Posts
W10: Dual y-axis
Categories: figure
Tags: line chart, dual axis, Surgery
Long time passed.
new figure to replicate is for dual-axis line chart.
Selected article:
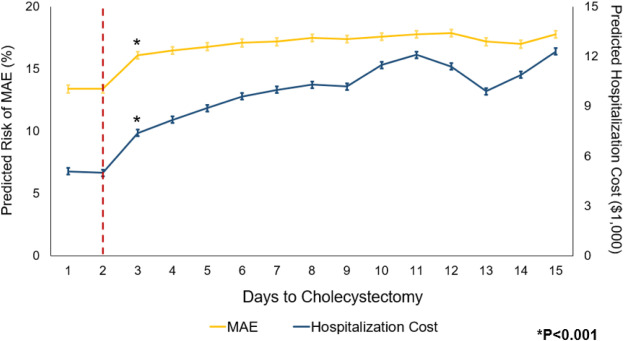
Title: Effect of surgical timing on outcomes after cholecystectomy for mild gallstone pancreatitis
Journal: Surgery
Authors: Cho NY, Chervu NL, Sakowitz S et al.
Year: 2023
PMID: 37355408
DOI: 10.1016/j.surg.2023.05.009
The original figure
Import libraries
library(tidyverse)
# library(scales)
# library(fabricatr)      # to fabricate fake data
# library(glue)           # to prepare label text
library(ggtext)         # to use markdown in labs (caption)


theme_set(theme_light())
Prepare fabricated data
# prepare a dataset for MAE and Cost:

chole_data <- tribble(
        ~ Day, ~ MAE, ~ Cost,
        1, 13, 5.1,
        2, 13, 5,
        3, 16.1, 7.6,
        4, 16.3, 8.7,
        5, 16.6, 9.7,
        6, 16.9, 10.4,
        7, 17.2, 10.6,
        8, 17.4, 10.8,
        9, 17.3, 10.6,
        10, 17.3, 11.5,
        11, 17.4, 12,
        12, 17.5, 11.4,
        13, 16.7, 10.6,
        14, 16.5, 11,
        15, 17.3, 12.3
)
Possible strategy:
Not a big trick. just usual geom_line(). but we need to add second axis with sec.axis argument within scale_y_continuous().
the key is to add a scale parameter: scale for y2/y1
No data tidying is needed because I used exact values.
R codes for the figure
col_mae <- "#F5C94F"
col_cost <- "#405D80"
col_vline <- "#C24C46"
scale <- 15/20 # This is key for scaling second axis. Use it in every value related to second axis.
eb_height <- .25
my_linewidth <- .7
shape_size <- 6
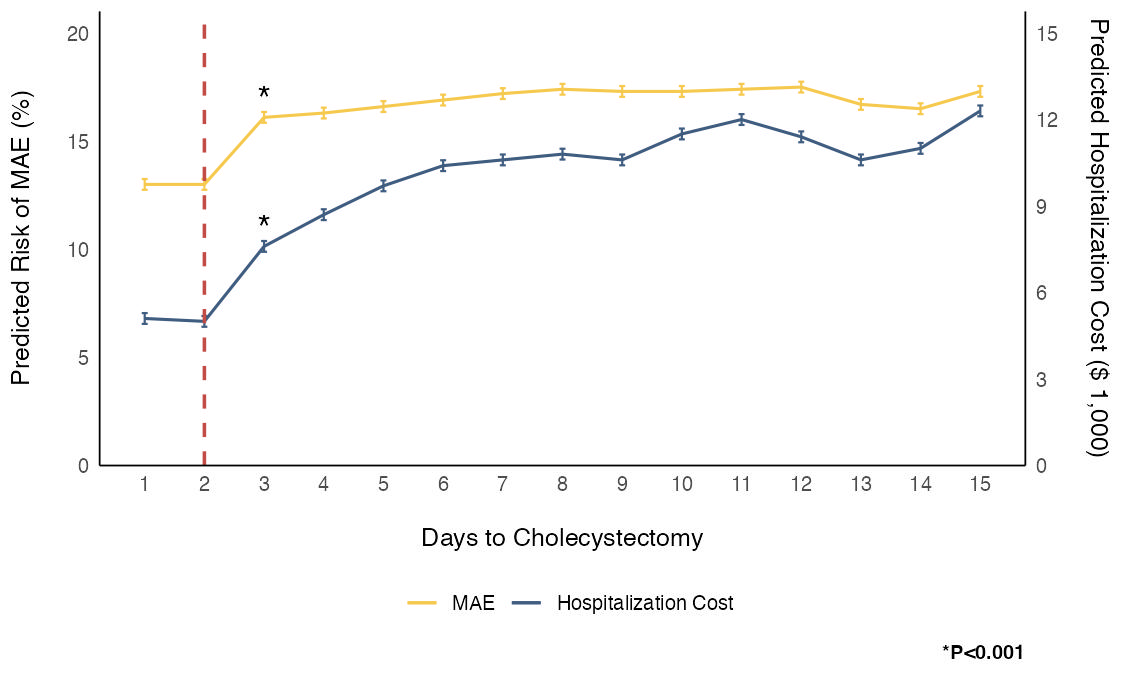
final_replica <- chole_data %>%
ggplot(aes(Day)) +
geom_line(aes(y = MAE, color = "MAE"),
linewidth = my_linewidth) +
geom_line(aes(y = Cost/scale, color = "Cost"),
linewidth = my_linewidth) +
geom_errorbar(aes(ymin = MAE - eb_height, ymax = MAE + eb_height),
width = .1, color = col_mae) +
geom_errorbar(aes(ymin = Cost/scale - eb_height, ymax = Cost/scale + eb_height),
width = .1, color = col_cost) +
geom_vline(xintercept = 2, color = col_vline, linetype = 2, linewidth = .8) +
geom_point(data = . %>% filter(Day == 3),
aes(y = MAE + 1.2),
shape = "*", size = shape_size) +
geom_point(data = . %>% filter(Day == 3),
aes(y = Cost/scale + 1.2),
shape = "*", size = shape_size) +
scale_x_continuous(breaks = seq(1, 15, 1)) +
scale_y_continuous(limits = c(0,20),
expand=expansion(mult = c(0, 0.05)),
sec.axis = sec_axis(~.* scale,
name="Predicted Hospitalization Cost ($ 1,000)\n",
breaks = seq(0,15,3))) +
labs(y = "Predicted Risk of MAE (%)\n",
x = "\nDays to Cholecystectomy",
color = "",
caption = "**\\*P<0.001**") +
scale_color_manual(
values = c("Cost" = col_cost, "MAE" = col_mae),
labels = c("MAE" = "MAE", "Cost" = "Hospitalization Cost"),
guide = guide_legend(reverse = TRUE)) +
theme(legend.position = "bottom",
panel.grid = element_blank(),
panel.border = element_blank(),
axis.line = element_line(color = "black", linewidth = .4),
plot.caption = element_markdown(),
axis.ticks = element_blank(),
text = element_text(size = 12, family = "Helvetica"))
### SAVE FIGURE
ggsave(final_replica,
file =file.path ("w10_replica.jpg"),
dpi = 150,
width = 7.5,
height = 4.5)
Final replica
Some personal comments:
- The resolution of the figure is low in the article.
- I would prefer some grid lines for y axis. and maybe some ticks.
- I do not like dual-axis plots.
- I would add some space around the plot.
Citation
Ali Guner (Jun 28, 2023) W10: Dual y-axis. Retrieved from https://datavizmed.com/blog/2023-06-28-week-10/
@misc{ 2023-w10-dual-y-axis,
author = { Ali Guner },
title = { W10: Dual y-axis },
url = { https://datavizmed.com/blog/2023-06-28-week-10/ },
year = { 2023 }
updated = { Jun 28, 2023 }
}