Posts
a question from twitter by JulienMouchnino,
can we prepare grouped summary table with flextable?
Although this is not related to medicine, can be used in any table, therefore I shared it here.
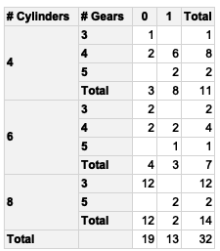
The original table
Import libraries
library(tidyverse)
library(flextable)
library(officer)
Possible strategy:
Although gt() packages provide row-based, column-based and all-based summary table, I prefer to complete summary as I desire.
Then, I use flextable() to modify my summarized tibble.
Summary table
summary_col <- mtcars %>%
        summarise(nb = n(), .by = c(cyl, gear, am)) %>%
        arrange(cyl, gear, am) %>%
        pivot_wider(names_from = "am",
                    values_from = "nb",
                    names_prefix = "am_",
                    values_fill = 0)  %>%
        mutate(total = am_0 + am_1)

summary_row <- summary_col %>%
        summarise(across(am_0:total, sum), .by = c("cyl")) %>%
        add_column(gear = "Total", .after = "cyl")

summary_all <- summary_row %>%
        summarise(across(am_0:total, sum)) %>%
        add_column(gear = "", .before = 1) %>%
        add_column(cyl = "Total", .before = 1)

summary_table <- bind_rows(
        summary_row %>%
                  mutate(across(everything(), as.character)),
        summary_col %>%
                  mutate(across(everything(), as.character)),
        summary_all %>%
                  mutate(across(everything(), as.character))) %>%
        arrange(cyl, gear) %>%
        mutate(across(am_0:total, ~str_replace_all(., "0", NA_character_)))
Convert summary table to flextable
col_table_border <- "#a6a6a6"
col_table_bg <- "#e6e6e6"

flex_summary <- summary_table %>%
        flextable() %>%
        border_remove() %>%
        set_table_properties(width = 1, layout = "autofit") %>%
        hline(part = "all", border = fp_border(color = col_table_border)) %>%
        vline(part = "all", border = fp_border(color = col_table_border)) %>%
        border_outer(border = fp_border(color = col_table_border), part = "all") %>%
        set_header_labels(cyl = "# Cylinders",
                          gear = "# Gears",
                          am_0 = "0",
                          am_1 = "1",
                          total = "Total") %>%
        fix_border_issues() %>%
        merge_v(j = "cyl") %>%
        bold(part = "header") %>%
        bold(part = "body", j = 1:2) %>%
        align(part = "header", align = "left") %>%
        align(j = 3:5, align = "right") %>%
        bg(part = "header", bg = col_table_bg) %>%
        bg(part = "body", j = 1:2, bg = col_table_bg) %>%
        font(fontname = "Helvetica")
Save flextable object as a word file
save_as_docx(flex_summary,
             path = here::here("content", "blog", "2023-10-13-week-11", paste0("flex_summary", ".docx")))
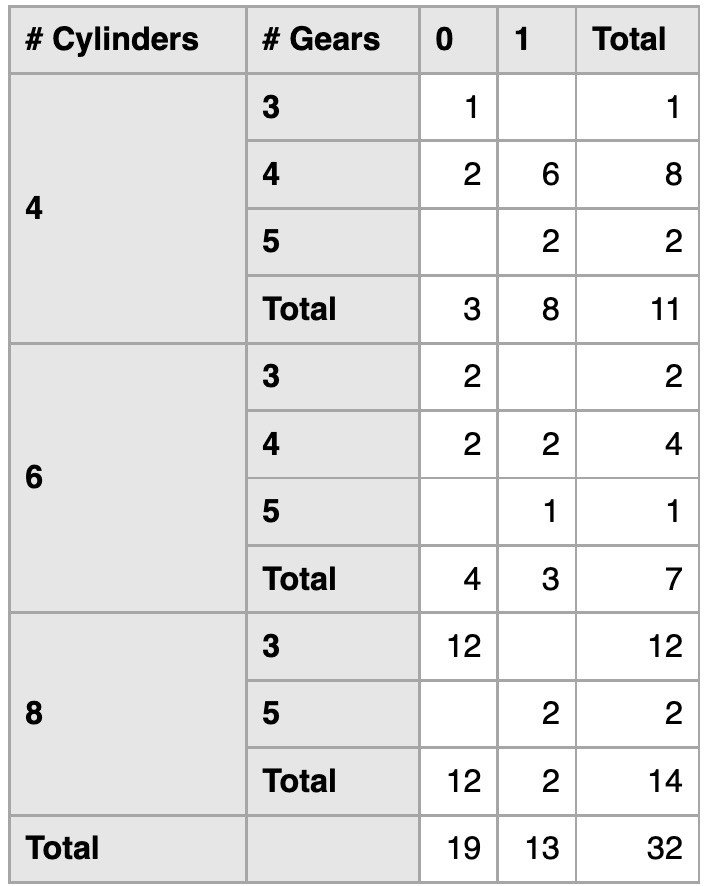
Final replica
Citation
For attribution, please cite this work as
Ali Guner (Oct 13, 2023) W11: Custom summary table. Retrieved from https://datavizmed.com/blog/2023-10-13-week-11/
BibTeX citation
@misc{ 2023-w11-custom-summary-table,
author = { Ali Guner },
title = { W11: Custom summary table },
url = { https://datavizmed.com/blog/2023-10-13-week-11/ },
year = { 2023 }
updated = { Oct 13, 2023 }
}